
SKYLAB Digital Forester
Aerial plantation inventory and stock modelling
With our Digital Forester algorithms, we analyse your drone or plane images to provide you with a precise inventory of your plantation. We deliver digital terrain and tree height models, tree count and densities, height statistics and stock modelling. So you can make better decisions, reduce costs and maximise productivity.

Tree Height Model, tree count and heights
YOUR BENEFITS AND SAVINGS
- Reduce terrestrial sampling by up to 90%
- Faster, fully-digital data, no need for manual data-entry or processing
- 100% coverage of stand at no extra cost
- Immediately see performance variation and failures across the whole stand
- Better harvest planning, optimised pricing for selling or buying standing stock.
- Foresters can focus on quality and management actions
- Clear and easy-to-use maps can be customised to your requirements
HOW IT WORKS
- Diameter and height correlations for volume assessments
- Uncertainty of spot sampling is massively reduced: we analyse 100% of your plantation
- Height accuracy: 97%
- Volume accuracy: 90-95%
- Just use standard drones, such as DJI Mavic Pro 2
- We can help you with flight planning

Optimised sampling design
Maximise your starting stock to achieve optimum yields and ROI. No more ‘dead capital’ in underperforming hectares. Density maps provide clear evidence for success-based planting payments.
Optimise rotation, maximise yield and profitability.
With precision forestry maps you can manage your stands based on detailed information for each 0.25ha area.

High resolution Orthophoto gives immediate overview of your stand.
Tree Height Model (THM) shows detailed heights across the stand and variations in growth.
Diameter (DBH) distribution, based on DBH-height correlations, with optimised sampling reduced by 50-90%.
Tree Density maps help to plan thinning and harvesting operations
and predict yield.
Timber Volume can be predicted and management operations precisely planned for ¼ ha grid cells.
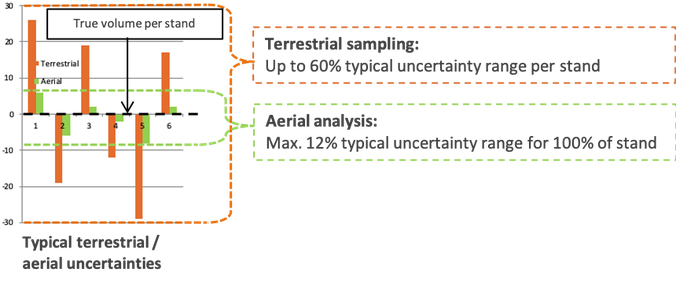
Reduce your sampling uncertainty and sampling efforts by 80%, while increasing accuracy of results per stand!
Typical uncertainties for stand volume estimate are reduced by 80%:
„With SKYLAB you can make better decisions and more precise yield projections, avoid over- or underdelivery, optimise rotations, and maximise yields and profitability.“ Alexander von Engel, CMO SKYLAB
SKYLAB Digital Forester Report
Using our exemplary evaluation, you can get to know the advantages and possibilities for yourself. Please download.
Questions? Need help to get started?
Please contact Albrecht von Ruffer
ruffer@skylabglobal.com
+49 177 65 15 964
How it works.

PROCESS
Upload your data to SKYLAB servers and tell us about your goals for the data analsyis. Full forest inventory or just an orthomosaic with tree count? Simple stress index map or a fully fledged bark beetle infection analysis? Just a 3D Pointcloud of your power line or rail track or with full vegetation and risk mapping? Select your desired parameters for high quality processing and we will quality check and process your data with short response times and recommendations for future quality improvements on the raw data.

RESULTS
Our algorithms carry out the analysis of your raw data to provide you with the desired, high quality output. Resulting maps and data are made available via the SKYLABmaps web-based platform (where you can edit, share and download the information) as well as vectorized datafiles for easy integration into your GIS tools. You can also view the results on your mobile device anywhere in the field.
We are happy to help you make the most of the results by assisting you with the integration into your management system as well as
with the further interpretation of the results to achieve your desired objective.